Chapter 20 — Price Stability
Cambridge International AS & A Level Economics (9708) · Unit 4.6 · 4th edition coursebook
Learning objectives
- Define the meaning of inflation, deflation and disinflation.
- Calculate the rate of inflation.
- Explain how changes in the price level are measured by the consumer price index.
- Consider the difficulties of measuring changes in the price level.
- Explain the difference between money values and real data.
- Analyse the causes and types of inflation: cost-push and demand-pull inflation.
- Analyse the consequences of inflation.
Key terms
- barter
- Direct exchange of goods and services for other goods and services.
- price stability
- A low and stable inflation rate.
- inflation rate
- The percentage rise in an economy's price level over a period of time.
- inflation
- A sustained increase in an economy's price level over a period of time.
- price level
- The average of all prices in an economy.
- creeping inflation
- A low rate of inflation.
- hyperinflation
- A very high rate of inflation, which may result in people losing confidence in the currency.
- deflation
- A sustained fall in the price level.
- disinflation
- A fall in the inflation rate.
- annual average method
- A way of calculating the inflation rate by comparing the average level of prices during a twelve-month period with the average level in the previous twelve months.
- year-on-year method
- A way of calculating the inflation rate by comparing the percentage change in the price level for a given month with that of the same month of the previous year.
- consumer price index (CPI)
- A measure that shows the average change in the prices of a representative basket of products purchased by households.
- money values
- Values at the prices operating at the time.
- real data
- Data adjusted for inflation.
- cost-push inflation
- Inflation caused by increases in costs of production.
- wage-price spiral
- Higher wages causing prices to rise which, in turn, push up wages and so on.
- demand-pull inflation
- Inflation caused by increases in aggregate demand not matched by equivalent increases in aggregate supply.
- monetarists
- Economists who consider that inflation is caused by an excessive growth in the money supply.
- menu costs
- Costs to firms of having to change prices due to inflation.
- shoe leather costs
- Costs of moving money around in search of the highest interest rate.
- fiscal drag
- The income of people and firms being pushed into higher tax brackets as a result of inflation.
- inflationary noise
- Confusion over relative prices caused by inflation.
- total cost
- The sum of fixed costs and variable costs.
- debtors
- People, firms or governments who owe money.
20.1What is price stability?
Price stability occurs when prices rise by only a small percentage and there is an absence of large fluctuations in the price level. A low and stable inflation rate brings a number of advantages, which is why most governments aim for price stability. The objective is not always achieved: some countries experience high inflation rates with prices rising by a large percentage; others experience big fluctuations from one year to the next; and at certain times some countries experience a fall in their price level.
Key concept link — Progress and development
Price stability can encourage firms to expand. Higher national output can create employment, as well as increasing the goods and services available for governments to spend on education and healthcare.
20.2Inflation, deflation and disinflation
Inflation does not mean that every price rises, or that all prices rise at the same rate. It means that, on average, prices are rising. The inflation rate expresses this average change as a percentage. When the price level rises, the value of money falls and its purchasing power declines — each unit of currency buys less than before.
Degrees of inflation
A low and stable rate of inflation is generally not regarded as a problem; a slow, steady rise in prices may even encourage firms to produce more. Such a rate is sometimes called creeping inflation.
At the other extreme is hyperinflation, generally taken to mean an inflation rate exceeding 50% a month, although in practice the rate can go much higher. Hyperinflation occurs when inflation gets out of control. People may lose confidence in the currency and resort to barter, directly exchanging goods and services rather than using money. In such cases the currency usually has to be replaced by a new currency unit.
Deflation and disinflation
Deflation is a sustained fall in the price level. It raises the value of money — each unit of currency has more purchasing power — and corresponds to a negative inflation rate, for example −3%.
Disinflation, by contrast, is a fall in the inflation rate that leaves it still positive. The price level is still rising, but more slowly than before — for example a fall in inflation from 8% to 6% is disinflation, not deflation.

Disinflation is a fall in the rate at which prices are rising — prices are still going up, just more slowly. It is distinct from deflation (a fall in the price level itself), from a fall in output, or from a fall in national income. So option C captures the precise definition.
20.3Calculating the inflation rate
The inflation rate is the percentage change in the price level from one period to another. The period can be a month, a quarter, or a year. The two methods of comparison most used by economists are the annual average method and the year-on-year method.
- The annual average method compares the average price level during a twelve-month period with the average price level in the previous twelve months.
- The year-on-year method calculates the percentage change in the price level for a given month relative to the same month of the previous year. For example, if the price index rises from 120 in one June to 126 the following June, the inflation rate is (6 ÷ 120) × 100 = 5%.
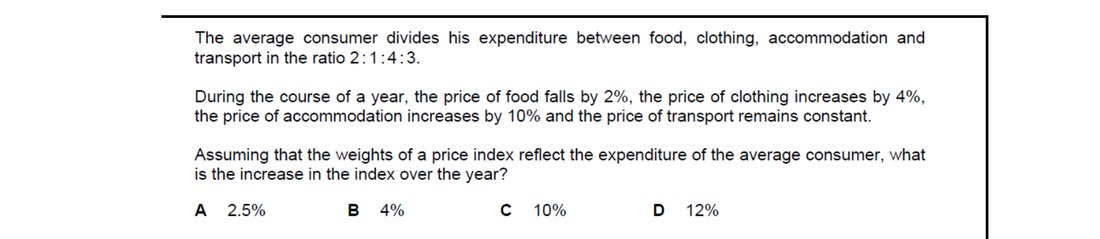
Applying the weights (2:1:4:3, summing to 10) to the price changes gives a weighted average: (2×(−2) + 1×(+4) + 4×(+10) + 3×(0)) / 10 = (−4 + 4 + 40 + 0) / 10 = 4%. So the index rose by 4% over the year — option B.
20.4Measurement of inflation and deflation
A country's price level shows how much it costs to live in that country. A rise in the price level means that the cost of living has gone up. To assess changes in the cost of living, governments construct a consumer price index (CPI).
There are five main stages in constructing a CPI:
- Select a base year — usually a year in which nothing unusual has happened. The base year is given an index value of 100, and is changed regularly.
- Carry out a survey of households' spending patterns. A sample of households in the population is asked to keep a record of what they spend, grouped into categories such as food, clothing and footwear, and so on.
- Attach weights to the different categories, based on the proportion of total expenditure that households spend in each category. For example, if households on average spend $500 of a total $2000 on food, food is given a weight of 25%.
- Find out price changes across a range of retail outlets and from other sources such as utility and transport companies.
- Multiply weights by price changes and sum the results. The total gives the change in the consumer price index.
20.5The difficulties of measuring changes in the price level
Difficulties can arise at most stages of constructing a CPI.
The base year
It can be hard to choose a base year. If a year is selected in which inflation was later found to have been unusually high, subsequent percentage changes in the price level can look misleadingly low.
The survey
Two key problems arise in surveying households. First, the people surveyed may not be representative of the whole population — if, say, a higher proportion of vegetarians complete the survey than is found in the population, the weight given to vegetables in the basket will be too high. Second, even a representative survey gives only an average inflation rate; different groups have different spending patterns and therefore face different effective inflation rates. Elderly people, for example, may spend more than most on heating fuels, and so be hit harder by a rise in fuel prices than the young.
Respondents may make mistakes in recording their spending or may deliberately leave items out — for example under-reporting of spending on chocolate is sometimes mentioned.
The basket of goods and services
The basket and its weights can become out of date. Most governments update the basket regularly so that the weights remain representative of current spending patterns, but between updates the basket is fixed. Consumers react in the meantime to changes in relative prices — if, say, green tea rises in price by more than black tea, they switch to black tea — and the fixed basket misses this.
Most governments now assume that there is some substitution between brands or types of a product, but they do not allow for substitution between very different categories such as bus travel and car travel. As a result the CPI does not fully reflect how consumers react to changes in relative prices.
The basket is slow to include new products and remove old ones. Each year only a small number of new products are added and old ones removed.
Quality bias
Quality changes can distort the CPI. A washing machine may rise 4% in price but offer additional features and a longer life — consumers are getting better value for money, but a simple price comparison misses this. The reverse can also happen: a product's price may stay the same while its quality or size declines (sometimes called shrinkflation). Some governments try to overcome this by putting a monetary value on quality changes — adding to the price when quality falls and removing the value when quality improves — but estimating these values is difficult in practice.
The accuracy of a country's CPI therefore depends on whether there are sampling errors, how often the basket is updated, and how well government statisticians can adjust for substitution and quality bias.
20.6The difference between money values and real data
Money values, or nominal values, are values expressed in the prices ruling at the time. Real data have been adjusted for inflation. To convert money values to real values, multiply by the price index in the base year and divide by the price index in the current year:
Real value = money value × (price index in base year ÷ price index in current year)
For example, a worker whose money wage rises from $5 000 to $6 000 has had a 20% pay rise in money terms. If the consumer price index rises from 100 to 125 over the same period, the worker's real wage falls — applying the formula gives a real wage of $4 800, a decline of 4%. A 20% money pay rise with 25% inflation leaves the worker able to buy fewer goods and services than before.
Changes in real data can be roughly estimated by subtracting the change in the inflation rate from the change in the money value. For example, a money interest rate (sometimes called the nominal interest rate) of 5% with inflation of 6% gives a real interest rate of approximately −1%.
20.7The causes of inflation
There are two main causes of inflation: cost-push inflation and demand-pull inflation.
Cost-push inflation
Cost-push inflation occurs when prices are pushed up by increases in the costs of production. A decrease in aggregate supply caused by higher costs raises the price level, causes a contraction in aggregate demand, and reduces real GDP (see Figure 20.5).
A number of costs may rise. Wages may increase by more than labour productivity, raising unit labour costs. Higher wages can set off a wage-price spiral, in which workers gain a wage rise, prices then rise in response, and workers then seek a further wage rise to restore the real value of their pay. Increases in raw material and fuel costs can also push up prices; sometimes these increases are caused by a fall in the exchange rate, which raises the price of imported inputs. An increase in firms' profit margins also raises costs, and costs can be pushed up by damage to or depletion of resources, for example bad weather reducing the fertility of land or a fall in supplies of oil.
Demand-pull inflation
Demand-pull inflation occurs when prices are pulled up by increases in aggregate demand that are not matched by equivalent increases in aggregate supply. Any of the components of aggregate demand can be responsible: a consumer boom, a rise in government spending, higher business confidence raising investment, or an increase in net exports. On an AD/AS diagram, a shift of AD to the right raises the price level (see Figure 20.6).
A given rise in aggregate demand has a larger impact on the price level the closer the economy is to full capacity. An increase in some forms of government spending and investment need not be inflationary in the long run: spending on education, for example, can raise labour productivity and so raise productive capacity, allowing supply to rise alongside demand.
Monetarists argue that the key cause of higher aggregate demand is an increase in the money supply: if the money supply grows more rapidly than output, the greater supply of money drives up the price level. Some economists treat 'monetary inflation' as a specific cause. Keynesians, by contrast, argue that the causation often runs the other way: rising costs lead firms to borrow more from banks, which expands the quantity of money. There is broad agreement that money supply and the price level move together, but disagreement about which causes which.
The link between demand-pull and cost-push inflation
Some changes both raise aggregate demand and raise costs of production. A fall in the foreign exchange rate, for instance, raises the price of imported raw materials (cost-push) and at the same time tends to increase export revenue (demand-pull).
Once inflation has started, an inflationary spiral can develop in which demand-pull and cost-push factors reinforce each other. Higher government spending on pensions, for example, raises aggregate demand and so raises prices; higher prices encourage workers to demand higher wages; the higher wages raise costs of production and so reduce aggregate supply; and the higher wages also raise consumer expenditure, pushing prices up again.
Key concept link — Equilibrium and disequilibrium
If increases in AS can keep pace with increases in AD, the economy can move to new macroeconomic equilibriums without any inflationary pressure.
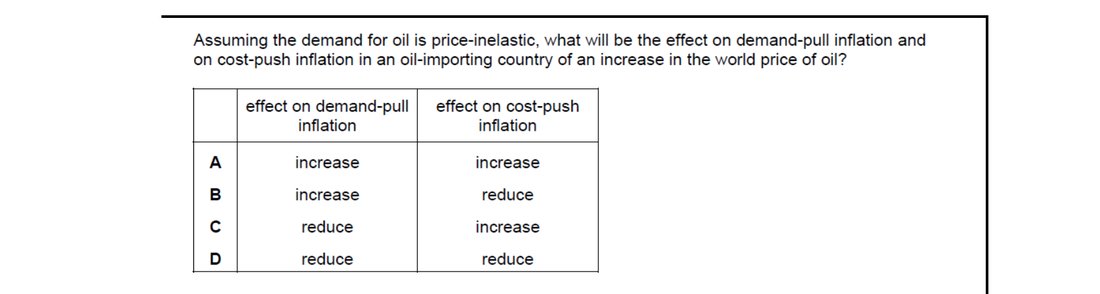
A rise in oil prices is a cost-push shock: as oil is an input, firms' production costs rise across the economy, shifting SRAS leftward — cost-push inflation increases. Because oil demand is price-inelastic, consumers spend more on oil (much of it imported) and have less to spend on other domestic goods, so domestic demand-pull pressure actually falls.
20.8The consequences of inflation
Inflation has both potential costs and potential benefits.
The possible costs of inflation
- A reduction in net exports. Inflation may reduce the international competitiveness of a country's products, raising import expenditure and lowering export revenue, with possible balance of payments problems.
- An unplanned redistribution of income. Some people gain and some lose. If the rate of interest does not rise in line with inflation, borrowers gain (they pay back less in real terms) and lenders lose. Savers lose too, as the real value of their savings falls.
- Menu costs — the costs of changing prices, including reprinting catalogues, price tags, bar codes and advertisements. Changing prices also takes staff time and is unpopular with customers.
- Shoe leather costs — the costs involved in moving money from one financial institution to another in search of the highest rate of interest.
- Fiscal drag (also called 'bracket creep') — when the income levels at which different tax rates apply are not adjusted in line with inflation, people and firms are pulled into higher tax brackets. It can be argued that this is a cost of an inefficient tax system rather than of inflation itself.
- Discouragement of investment. Unanticipated inflation creates uncertainty and makes it harder for firms to plan ahead, which may discourage investment and so harm economic growth.
- Inflationary noise (also called 'money illusion') — when inflation makes it difficult to read price signals. A rise in a product's price may not mean it has become more expensive relative to other products; it may have risen by less than the average and so be cheaper in real terms. Inflationary noise can lead consumers and firms to make wrong decisions, including a misallocation of resources.
- Inflation causing inflation. Once inflation is expected, consumers, workers and firms act in ways that make it self-perpetuating — workers demand higher wages, firms raise prices to cover expected higher costs, and consumers buy more now to beat further rises.
The potential benefits of inflation
- Stimulates output. A low and stable inflation rate driven by demand may make firms optimistic about the future. If prices rise faster than costs, profits increase, providing funds for investment. Investment may also be encouraged by lower real interest rates, and consumer expenditure may rise as higher money incomes make households feel better off even if their real income is unchanged.
- Reduces the burden of debt. Real interest rates may fall — or even become negative — because money interest rates do not always rise in line with inflation. As a result, debt burdens fall: borrowers, for example those repaying mortgages, see their real payments decline. A lower debt burden can stimulate consumer expenditure, raising output and employment.
- Prevents some unemployment. Firms in difficulty may need to reduce costs to survive. With zero inflation they may have to cut their labour force; with inflation, they can keep money wages constant or raise them by less than inflation, allowing real labour costs to fall without redundancies. Workers with weak bargaining power may be less able to resist these real wage cuts than workers with strong bargaining power.
Factors affecting the consequences of inflation
The impact of inflation depends on several factors:
- The cause. Demand-pull inflation is generally less harmful than cost-push inflation, because the former tends to be associated with rising output and the latter with falling output.
- The rate. A high inflation rate causes more damage than a low one, and hyperinflation can lead to households and firms losing confidence in the currency and even to the fall of governments.
- Whether the rate is stable or accelerating. An accelerating or fluctuating inflation rate creates uncertainty and discourages investment; firms also have to spend more time and effort estimating future inflation.
- Whether inflation is anticipated. If households, firms and the government correctly anticipate inflation, they can adapt to it — for example, firms can adjust their prices, money interest rates can be set to maintain real interest rates, and the government can adjust tax brackets, pensions and public-sector wages in line with inflation.
- How the rate compares with that of other countries. A country can have a relatively high rate of inflation but still gain in international competitiveness, if its rate is lower than that of competing countries.
Recent reductions in global inflation
In many countries, inflation has been comparatively low in recent years, and several reasons are usually offered for this. Advances in technology have helped to keep costs down and have allowed higher aggregate demand to be met by higher aggregate supply, so that demand pressure does not translate into rising prices. Increased international competition has made firms more reluctant to raise prices, because higher prices would simply drive customers to foreign competitors. There have also been changes in many labour markets, including a fall in trade-union membership and a growth in casual or short-term employment. These changes have reduced workers' bargaining power and so reduced upward pressure on wages, weakening the wage-price spiral.
Even when prices are rising, inflation does not always reduce the purchasing power of households. It does so other things being equal, but if wages rise by more than prices, real incomes rise and households can buy more goods and services than before.
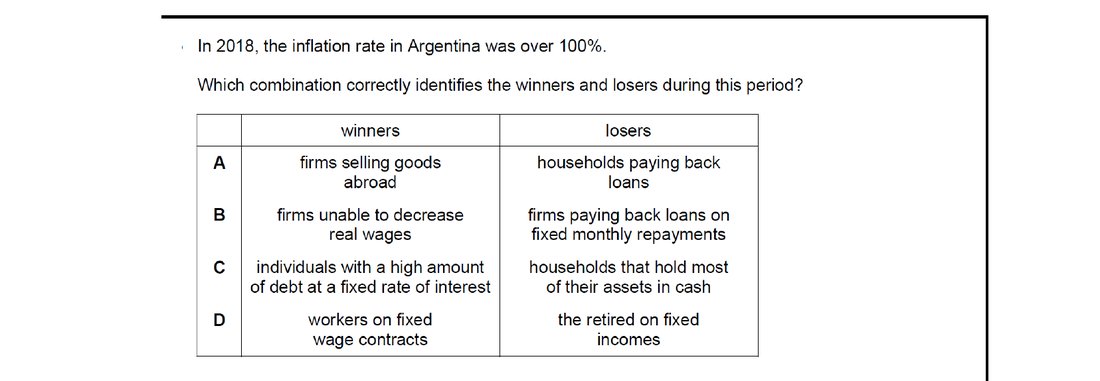
Inflation redistributes wealth from those holding nominal claims to those owing them. Borrowers with fixed-rate debt win because the real value of repayments shrinks; households holding most of their wealth as cash lose because their savings buy less. Option C correctly pairs a clear winner with a clear loser under 100%+ inflation.
20.9Extension: The causes and consequences of deflation
Deflation raises the burden of debt, may raise the real rate of interest, and creates menu costs. Whether deflation is harmful overall depends on its cause. Economists distinguish between good deflation and bad deflation.
Good deflation occurs as a result of an increase in aggregate supply (see Figure 20.9). The AS curve shifts to the right; the price level falls and real GDP rises. Advances in technology, for example, can create new methods of production and lower costs. As well as a rise in output, employment may grow and the country's products may become more internationally competitive.
Bad deflation occurs when the price level is driven down by a fall in aggregate demand (see Figure 20.10). Output falls, which may cause higher unemployment. Bad deflation runs the risk of developing into a deflationary spiral. Consumers may delay purchases, expecting prices to fall further. Firms, seeing lower demand, may cut back on investment and reduce employment. Some debtors may get into difficulty, which can cause banks to get into difficulty too, with the risk of some failing and their customers losing money. These effects reduce demand further, and economic activity declines again.
Inflation versus deflation
Most governments aim for a low and stable rate of inflation rather than a fall in the price level. There are two main reasons. First, a low rate of demand-pull inflation is thought to promote economic growth. Second, measures of inflation tend to overstate the true rate, because they often fail to fully account for quality improvements and for consumers switching to lower-priced products.
End-of-chapter practice
Past-paper questions from CIE 9708. Pick A, B, C or D. Answers are saved on this device — press Download report (PDF) at the top to save them.
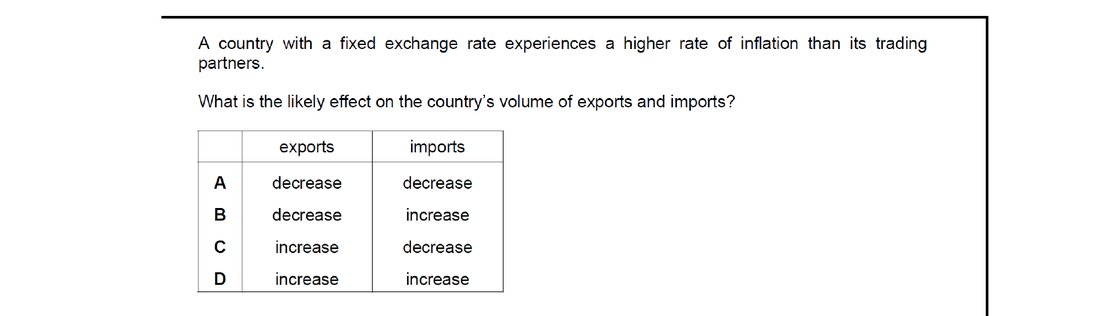
With a fixed exchange rate, domestic prices that rise faster than those of trading partners become uncompetitive. Exports look dearer abroad, so the volume sold falls. At the same time, imports become relatively cheaper than domestic goods, so import volumes rise. The combination is a falling export volume and a rising import volume — option B.

Demand-pull inflation results from aggregate demand rising faster than aggregate supply. A larger government budget deficit means either more spending or lower taxes, both of which add to AD. With the economy near capacity, this extra demand pulls prices up — exactly the demand-pull mechanism.
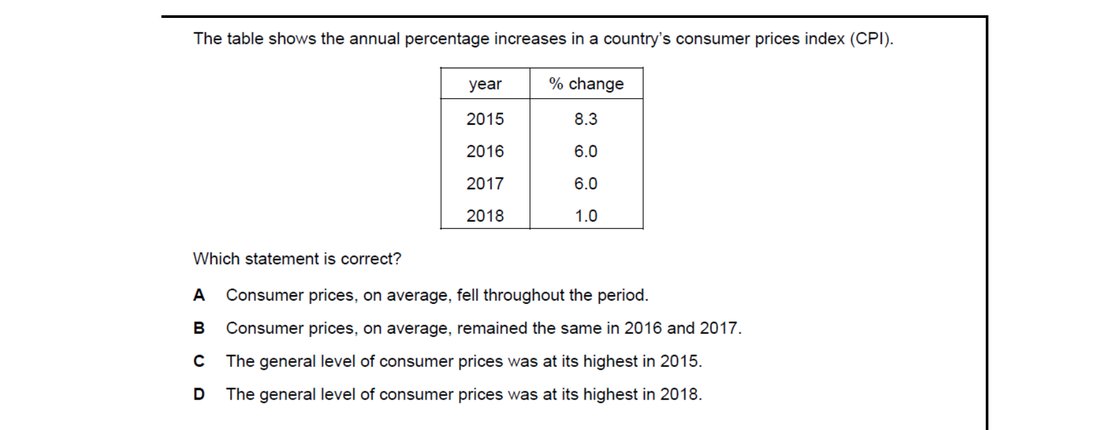
Every annual figure shown (8.3%, 6.0%, 6.0%, 1.0%) is positive, so the price level rose every year of the period. Prices did not fall in any year, nor stay unchanged in 2016/17 — the rate of increase fell, but the level kept climbing. The cumulative effect is that the price level peaked in 2018, the final year.

A good store of value should hold its real worth as prices rise. Fixed-interest government securities pay a fixed nominal coupon and return a fixed nominal principal — when inflation is rapid, the purchasing power of those payments collapses. Antiques, houses and company shares tend to appreciate broadly with the price level, preserving real value far better.

Inflation erodes the real value of money incomes that are not adjusted to keep pace. Workers on fixed wages cannot renegotiate quickly, so their real wages fall and they suffer most. Borrowers actually gain (real debt falls), importers may gain or lose depending on the currency, and producers can typically pass higher costs through to prices.
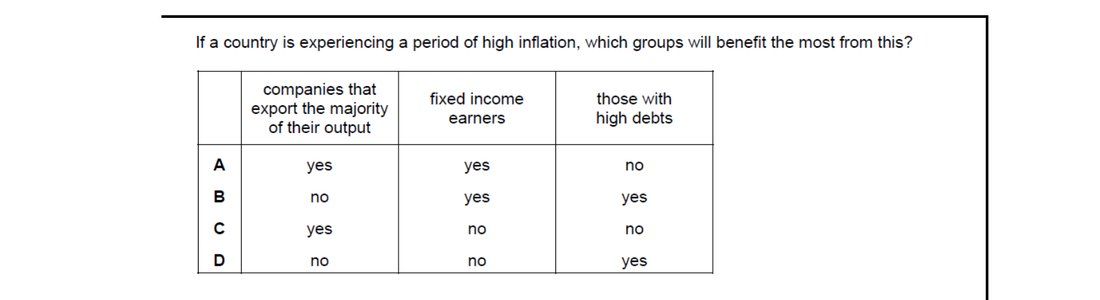
Inflation hands a clear gain to anyone with nominal debt at a fixed interest rate — the real value of what they owe shrinks as prices rise. Exporters whose prices stay sticky lose competitiveness, and people on fixed incomes see their real purchasing power fall. So only the group with high debts benefits.
Attempt the practice questions above to build your score.
Self-evaluation checklist
After studying this chapter, you should be able to:
- Understand that price stability occurs when prices rise by only a small percentage and there is an avoidance of fluctuations in the price level.
- Distinguish between inflation as a rise in the price level, deflation as a fall in the price level and disinflation as a fall in the inflation rate.
- Calculate the inflation rate using the annual average method and the year-on-year method.
- Explain how governments assess changes in the cost of living by constructing a consumer price index.
- Consider the difficulties of measuring changes in the price level.
- Explain the difference between money values and real data.
- Analyse the main causes of inflation: increases in aggregate demand (demand-pull inflation) or decreases in aggregate supply (cost-push inflation).
- Discuss the benefits and disadvantages of inflation.
Want more practice? Drill this chapter's past-paper MCQs (102 questions) →